NumPy 博客总结:
《Python数据分析基础教程:NumPy学习指南(第2版)》所有章节阅读笔记+代码
pandas博客总结:
melt函数-df长宽变形大师 - melt的重塑神功【melt函数的介绍与练习】
本篇博客是力扣的“30天pandas挑战”。—–一共30题
第一类:条件筛选
595. 大的国家
World 表:
1
2
3
4
5
6
7
8
9
10
11
+-------------+---------+
| Column Name | Type    |
+-------------+---------+
| name        | varchar |
| continent   | varchar |
| area        | int     |
| population  | int     |
| gdp         | bigint  |
+-------------+---------+
name 是该表的主键(具有唯一值的列)。
这张表的每一行提供:国家名称、所属大陆、面积、人口和 GDP 值。
如果一个国家满足下述两个条件之一,则认为该国是 大国 :
- 面积至少为 300 万平方公里(即,
3000000 km2),或者 - 人口至少为 2500 万(即
25000000)
编写解决方案找出 大国 的国家名称、人口和面积。
按 任意顺序 返回结果表。
返回结果格式如下例所示。
示例:
1
2
3
4
5
6
7
8
9
10
11
12
13
14
15
16
17
18
输入:
World 表:
+-------------+-----------+---------+------------+--------------+
| name        | continent | area    | population | gdp          |
+-------------+-----------+---------+------------+--------------+
| Afghanistan | Asia      | 652230  | 25500100   | 20343000000  |
| Albania     | Europe    | 28748   | 2831741    | 12960000000  |
| Algeria     | Africa    | 2381741 | 37100000   | 188681000000 |
| Andorra     | Europe    | 468     | 78115      | 3712000000   |
| Angola      | Africa    | 1246700 | 20609294   | 100990000000 |
+-------------+-----------+---------+------------+--------------+
输出:
+-------------+------------+---------+
| name        | population | area    |
+-------------+------------+---------+
| Afghanistan | 25500100   | 652230  |
| Algeria     | 37100000   | 2381741 |
+-------------+------------+---------+
我写的答案:
1
2
3
4
import pandas as pd

def big_countries(world: pd.DataFrame) -> pd.DataFrame:
    return world[(world['area'] >= 3000000) | (world['population'] >= 25000000)][['name','population', 'area']]
1757. 可回收且低脂的产品
表:Products
1
2
3
4
5
6
7
8
9
10
+-------------+---------+
| Column Name | Type    |
+-------------+---------+
| product_id  | int     |
| low_fats    | enum    |
| recyclable  | enum    |
+-------------+---------+
product_id 是该表的主键(具有唯一值的列)。
low_fats 是枚举类型,取值为以下两种 ('Y', 'N'),其中 'Y' 表示该产品是低脂产品,'N' 表示不是低脂产品。
recyclable 是枚举类型,取值为以下两种 ('Y', 'N'),其中 'Y' 表示该产品可回收,而 'N' 表示不可回收。
编写解决方案找出既是低脂又是可回收的产品编号。
返回结果 无顺序要求 。
返回结果格式如下例所示:
示例 1:
1
2
3
4
5
6
7
8
9
10
11
12
13
14
15
16
17
18
19
20
输入:
Products 表:
+-------------+----------+------------+
| product_id  | low_fats | recyclable |
+-------------+----------+------------+
| 0           | Y        | N          |
| 1           | Y        | Y          |
| 2           | N        | Y          |
| 3           | Y        | Y          |
| 4           | N        | N          |
+-------------+----------+------------+
输出:
+-------------+
| product_id  |
+-------------+
| 1           |
| 3           |
+-------------+
解释:
只有产品 id 为 1 和 3 的产品,既是低脂又是可回收的产品。
我写的答案:
1
2
3
4
import pandas as pd

def find_products(products: pd.DataFrame) -> pd.DataFrame:
    return products[(products['low_fats']=="Y") & (products['recyclable']=="Y")][['product_id']]
🌟183. 从不订购的客户
Customers 表:
1
2
3
4
5
6
7
8
+-------------+---------+
| Column Name | Type    |
+-------------+---------+
| id          | int     |
| name        | varchar |
+-------------+---------+
在 SQL 中,id 是该表的主键。
该表的每一行都表示客户的 ID 和名称。
Orders 表:
1
2
3
4
5
6
7
8
9
+-------------+------+
| Column Name | Type |
+-------------+------+
| id          | int  |
| customerId  | int  |
+-------------+------+
在 SQL 中,id 是该表的主键。
customerId 是 Customers 表中 ID 的外键( Pandas 中的连接键)。
该表的每一行都表示订单的 ID 和订购该订单的客户的 ID。
找出所有从不点任何东西的顾客。
以 任意顺序 返回结果表。
结果格式如下所示。
示例 1:
1
2
3
4
5
6
7
8
9
10
11
12
13
14
15
16
17
18
19
20
21
22
23
24
输入:
Customers table:
+----+-------+
| id | name  |
+----+-------+
| 1  | Joe   |
| 2  | Henry |
| 3  | Sam   |
| 4  | Max   |
+----+-------+
Orders table:
+----+------------+
| id | customerId |
+----+------------+
| 1  | 3          |
| 2  | 1          |
+----+------------+
输出:
+-----------+
| Customers |
+-----------+
| Henry     |
| Max       |
+-----------+
我写的答案:
1
2
3
4
5
6
7
import pandas as pd
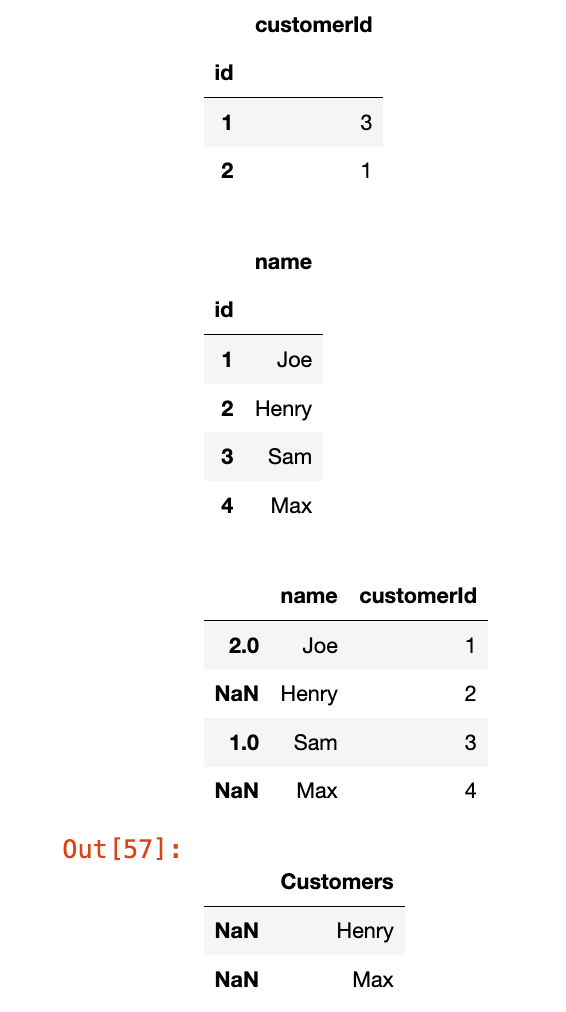
def find_customers(customers: pd.DataFrame, orders: pd.DataFrame) -> pd.DataFrame:
merged_df = pd.merge(customers, orders, left_index=True, right_on='customerId', how='left')
res = merged_df[~merged_df.index.isnull()][['name']]
res.columns = ["Customers"]
return res
是一步一步调试出来的,参考下面代码:
1
2
3
4
5
6
7
8
9
10
11
12
13
14
15
16
17
18
19
20
21
22
23
24
25
26
27
# Customers 表的数据
customers_data = {'id': [1, 2, 3, 4],
                  'name': ['Joe', 'Henry', 'Sam', 'Max']}

# Orders 表的数据
orders_data = {'id': [1, 2],
               'customerId': [3, 1]}

# 创建 Customers DataFrame
customers = pd.DataFrame(customers_data)
customers = customers.set_index('id') # 设置 id 列为主键(索引)

# 创建 Orders DataFrame
orders = pd.DataFrame(orders_data)
orders = orders.set_index('id')  # 设置 id 列为主键(索引)

display(orders)
display(customers)

merged_df = pd.merge(customers, orders, left_index=True, right_on='customerId', how='left')

display(merged_df)


res = merged_df[merged_df.index.isnull()][['name']]
res.columns = ["Customers"]
res
但是运行过了,提交就有错。
更简单的方法:
1
2
3
4
5
6
import pandas as pd

def find_customers(customers: pd.DataFrame, orders: pd.DataFrame) -> pd.DataFrame:
    res = customers[~customers['id'].isin(orders['customerId'])][['name']]
    res.columns = ["Customers"]
    return res
1148. 文章浏览 I
Views 表:
1
2
3
4
5
6
7
8
9
10
11
+---------------+---------+
| Column Name   | Type    |
+---------------+---------+
| article_id    | int     |
| author_id     | int     |
| viewer_id     | int     |
| view_date     | date    |
+---------------+---------+
此表可能会存在重复行。(换句话说,在 SQL 中这个表没有主键)
此表的每一行都表示某人在某天浏览了某位作者的某篇文章。
请注意,同一人的 author_id 和 viewer_id 是相同的。
请查询出所有浏览过自己文章的作者
结果按照 id 升序排列。
查询结果的格式如下所示:
示例 1:
1
2
3
4
5
6
7
8
9
10
11
12
13
14
15
16
17
18
19
20
21
输入:
Views 表:
+------------+-----------+-----------+------------+
| article_id | author_id | viewer_id | view_date  |
+------------+-----------+-----------+------------+
| 1          | 3         | 5         | 2019-08-01 |
| 1          | 3         | 6         | 2019-08-02 |
| 2          | 7         | 7         | 2019-08-01 |
| 2          | 7         | 6         | 2019-08-02 |
| 4          | 7         | 1         | 2019-07-22 |
| 3          | 4         | 4         | 2019-07-21 |
| 3          | 4         | 4         | 2019-07-21 |
+------------+-----------+-----------+------------+

输出:
+------+
| id   |
+------+
| 4    |
| 7    |
+------+
我写的答案:
1
2
3
4
5
6
7
import pandas as pd

def article_views(views: pd.DataFrame) -> pd.DataFrame:
    res = views[views['author_id'] == views['viewer_id']][['author_id']].drop_duplicates()
    res.columns = ["id"]
    res = res.sort_values(by='id', ascending=True)
    return res
第二类:字符串函数
1683. 无效的推文
表:Tweets
1
2
3
4
5
6
7
8
9
+----------------+---------+
| Column Name    | Type    |
+----------------+---------+
| tweet_id       | int     |
| content        | varchar |
+----------------+---------+
在 SQL 中,tweet_id 是这个表的主键。
content 只包含美式键盘上的字符,不包含其它特殊字符。
这个表包含某社交媒体 App 中所有的推文。
查询所有无效推文的编号(ID)。当推文内容中的字符数严格大于 15 时,该推文是无效的。
以任意顺序返回结果表。
查询结果格式如下所示:
示例 1:
1
2
3
4
5
6
7
8
9
10
11
12
13
14
15
16
17
18
输入:
Tweets 表:
+----------+----------------------------------+
| tweet_id | content                          |
+----------+----------------------------------+
| 1        | Vote for Biden                   |
| 2        | Let us make America great again! |
+----------+----------------------------------+

输出:
+----------+
| tweet_id |
+----------+
| 2        |
+----------+
解释:
推文 1 的长度 length = 14。该推文是有效的。
推文 2 的长度 length = 32。该推文是无效的。
我写的答案:
1
2
3
4
import pandas as pd

def invalid_tweets(tweets: pd.DataFrame) -> pd.DataFrame:
    return tweets[tweets['content'].apply(lambda x : len(x) > 15 )][['tweet_id']]
然后看到一个方法,是我原先的想法:
1
2
3
4
import pandas as pd

def invalid_tweets(tweets: pd.DataFrame) -> pd.DataFrame:
    return tweets[tweets['content'].str.len() > 15][['tweet_id']]
注:len(tweets['content'].str) 会报错,这个语句返回的是一个series对象,不可迭代;len函数需要是可迭代对象才能计数
1873. 计算特殊奖金
表: Employees
1
2
3
4
5
6
7
8
9
+-------------+---------+
| 列名        | 类型     |
+-------------+---------+
| employee_id | int     |
| name        | varchar |
| salary      | int     |
+-------------+---------+
employee_id 是这个表的主键(具有唯一值的列)。
此表的每一行给出了雇员id ,名字和薪水。
编写解决方案,计算每个雇员的奖金。如果一个雇员的 id 是 奇数 并且他的名字不是以 'M' 开头,那么他的奖金是他工资的 100% ,否则奖金为 0 。
返回的结果按照 employee_id 排序。
返回结果格式如下面的例子所示。
示例 1:
1
2
3
4
5
6
7
8
9
10
11
12
13
14
15
16
17
18
19
20
21
22
23
24
25
输入:
Employees 表:
+-------------+---------+--------+
| employee_id | name    | salary |
+-------------+---------+--------+
| 2           | Meir    | 3000   |
| 3           | Michael | 3800   |
| 7           | Addilyn | 7400   |
| 8           | Juan    | 6100   |
| 9           | Kannon  | 7700   |
+-------------+---------+--------+
输出:
+-------------+-------+
| employee_id | bonus |
+-------------+-------+
| 2           | 0     |
| 3           | 0     |
| 7           | 7400  |
| 8           | 0     |
| 9           | 7700  |
+-------------+-------+
解释:
因为雇员id是偶数,所以雇员id 是2和8的两个雇员得到的奖金是0。
雇员id为3的因为他的名字以'M'开头,所以,奖金是0。
其他的雇员得到了百分之百的奖金。
我的答案:
1
2
3
4
5
6
7
8
9
10
11
import pandas as pd

def calculate_special_bonus(employees: pd.DataFrame) -> pd.DataFrame:
    employees['salary'][(~employees['employee_id'] % 2 == 1) |
                    (employees['name'].str.startswith("M")) ] = 0
    res = employees.rename(
        columns={
            "salary":"bonus"
        }
    )
    return res[['employee_id', 'bonus']].sort_values(by='employee_id')
参考答案:(别人写的,但我感觉很不错)
1
2
3
4
5
6
import pandas as pd

def calculate_special_bonus(employees: pd.DataFrame) -> pd.DataFrame:
    employees['bonus'] = ((employees['employee_id'] % 2 == 1) & (employees['name'].str[0]!='M')) * employees['salary']
    employees = employees.sort_values('employee_id')
    return employees[['employee_id','bonus']]
1667. 修复表中的名字
表: Users
1
2
3
4
5
6
7
8
+----------------+---------+
| Column Name    | Type    |
+----------------+---------+
| user_id        | int     |
| name           | varchar |
+----------------+---------+
user_id 是该表的主键(具有唯一值的列)。
该表包含用户的 ID 和名字。名字仅由小写和大写字符组成。
编写解决方案,修复名字,使得只有第一个字符是大写的,其余都是小写的。
返回按 user_id 排序的结果表。
返回结果格式示例如下。
示例 1:
1
2
3
4
5
6
7
8
9
10
11
12
13
14
15
输入:
Users table:
+---------+-------+
| user_id | name  |
+---------+-------+
| 1       | aLice |
| 2       | bOB   |
+---------+-------+
输出:
+---------+-------+
| user_id | name  |
+---------+-------+
| 1       | Alice |
| 2       | Bob   |
+---------+-------+
我的答案:
1
2
3
4
5
import pandas as pd

def fix_names(users: pd.DataFrame) -> pd.DataFrame:
    users['name'] = users['name'].str.capitalize()
    return users.sort_values(by='user_id')
这道题其实就是考察一个函数capitalize(),没啥新鲜的。
🌟1517. 查找拥有有效邮箱的用户
表: Users
1
2
3
4
5
6
7
8
9
+---------------+---------+
| Column Name   | Type    |
+---------------+---------+
| user_id       | int     |
| name          | varchar |
| mail          | varchar |
+---------------+---------+
user_id 是该表的主键(具有唯一值的列)。
该表包含了网站已注册用户的信息。有一些电子邮件是无效的。
编写一个解决方案,以查找具有有效电子邮件的用户。
一个有效的电子邮件具有前缀名称和域,其中:
- 前缀 名称是一个字符串,可以包含字母(大写或小写),数字,下划线
'_',点'.'和/或破折号'-'。前缀名称 必须 以字母开头。 - 域 为
'@leetcode.com'。
以任何顺序返回结果表。
结果的格式如以下示例所示:
示例 1:
1
2
3
4
5
6
7
8
9
10
11
12
13
14
15
16
17
18
19
20
21
22
23
24
25
26
输入:
Users 表:
+---------+-----------+-------------------------+
| user_id | name      | mail                    |
+---------+-----------+-------------------------+
| 1       | Winston   | winston@leetcode.com    |
| 2       | Jonathan  | jonathanisgreat         |
| 3       | Annabelle | bella-@leetcode.com     |
| 4       | Sally     | sally.come@leetcode.com |
| 5       | Marwan    | quarz#2020@leetcode.com |
| 6       | David     | david69@gmail.com       |
| 7       | Shapiro   | .shapo@leetcode.com     |
+---------+-----------+-------------------------+
输出:
+---------+-----------+-------------------------+
| user_id | name      | mail                    |
+---------+-----------+-------------------------+
| 1       | Winston   | winston@leetcode.com    |
| 3       | Annabelle | bella-@leetcode.com     |
| 4       | Sally     | sally.come@leetcode.com |
+---------+-----------+-------------------------+
解释:
用户 2 的电子邮件没有域。
用户 5 的电子邮件带有不允许的 '#' 符号。
用户 6 的电子邮件没有 leetcode 域。
用户 7 的电子邮件以点开头。
1
2
3
4
5
import pandas as pd

def valid_emails(users: pd.DataFrame) -> pd.DataFrame:
    reg = r'^[A-Za-z][A-Za-z0-9_./-]*@leetcode\.com$'
    return users[users['mail'].str.match(reg, case=False)]
这道题关键是把正则看懂:
^: 匹配字符串的开头。[A-Za-z]: 必须以字母(大写或小写)开头。[A-Za-z0-9_.-]*: 允许字母、数字、下划线、点和破折号的组合,可以出现 0 次或多次。@XXX\.com: 强制要求以”@XXX.com“结尾,\.表示匹配实际的点字符.$: 匹配字符串的结尾.
最好@也转义一下:\@? 其实python 3.7以后的@字符不再需要转义
另外case=False可以不写,因为一开始已经写了^[A-Za-z]
1527. 患某种疾病的患者
患者信息表: Patients
1
2
3
4
5
6
7
8
9
10
+--------------+---------+
| Column Name  | Type    |
+--------------+---------+
| patient_id   | int     |
| patient_name | varchar |
| conditions   | varchar |
+--------------+---------+
在 SQL 中,patient_id (患者 ID)是该表的主键。
'conditions' (疾病)包含 0 个或以上的疾病代码,以空格分隔。
这个表包含医院中患者的信息。
查询患有 I 类糖尿病的患者 ID (patient_id)、患者姓名(patient_name)以及其患有的所有疾病代码(conditions)。I 类糖尿病的代码总是包含前缀 DIAB1 。
按 任意顺序 返回结果表。
查询结果格式如下示例所示。
示例 1:
1
2
3
4
5
6
7
8
9
10
11
12
13
14
15
16
17
18
19
输入:
Patients表:
+------------+--------------+--------------+
| patient_id | patient_name | conditions   |
+------------+--------------+--------------+
| 1          | Daniel       | YFEV COUGH   |
| 2          | Alice        |              |
| 3          | Bob          | DIAB100 MYOP |
| 4          | George       | ACNE DIAB100 |
| 5          | Alain        | DIAB201      |
+------------+--------------+--------------+
输出:
+------------+--------------+--------------+
| patient_id | patient_name | conditions   |
+------------+--------------+--------------+
| 3          | Bob          | DIAB100 MYOP |
| 4          | George       | ACNE DIAB100 |
+------------+--------------+--------------+
解释:Bob 和 George 都患有代码以 DIAB1 开头的疾病。
1
2
3
4
import pandas as pd

def find_patients(patients: pd.DataFrame) -> pd.DataFrame:
    return patients[patients['conditions'].str.contains(r'^DIAB1|\sDIAB1', regex=True)]
这题是真不会写了.因为无法提交成功,但是我拿官方的答案(方法1)试了下也通过不了(+DIAB1这个测试用例无法通过),和我的情况是一样的。上面这个解答是方法1修改成功之后的解法,也是评论区看的。
解释这个正则:^DIAB1匹配conditions字段以DIAB1开头的情况。 \sDIAB1匹配conditions中空格后紧跟DIAB1的情况。 | 是逻辑“或”的运算符,表示匹配两种情况中的任意一种。
测验题
2738. 统计文本中单词的出现次数
表:Files
1
2
3
4
5
6
7
8
+-------------+---------+
| 列名        | 类型    |
+-- ----------+---------+
| file_name   | varchar |
| content     | text    |
+-------------+---------+
file_name 为该表的主键(具有唯一值的列)。
每行包含 file_name 和该文件的内容。
编写解决方案,找出单词 ‘bull’ 和 ‘bear’ 作为 独立词 有出现的文件数量,不考虑任何它出现在两侧没有空格的情况(例如,’bullet’, ‘bears’, ‘bull.’,或者 ‘bear’ 在句首或句尾 不会 被考虑)。
返回单词 ‘bull’ 和 ‘bear’ 以及它们对应的出现文件数量,顺序没有限制 。
结果的格式如下所示:
示例 1:
1
2
3
4
5
6
7
8
9
10
11
12
13
14
15
16
17
18
19
20
21
22
23
24
输入:
Files 表:
+------------+----------------------------------------------------------------------------------+
| file_name  | contenet                                                                         |
+------------+----------------------------------------------------------------------------------+
| draft1.txt | The stock exchange predicts a bull market which would make many investors happy. |
| draft2.txt | The stock exchange predicts a bull market which would make many investors happy, |
|            | but analysts warn of possibility of too much optimism and that in fact we are    |
|            | awaiting a bear market.                                                          |
| draft3.txt | The stock exchange predicts a bull market which would make many investors happy, |
|            | but analysts warn of possibility of too much optimism and that in fact we are    |
|            | awaiting a bear market. As always predicting the future market is an uncertain   |
|            | game and all investors should follow their instincts and best practices.         |
+------------+----------------------------------------------------------------------------------+
输出:
+------+-------+
| word | count |
+------+-------+
| bull | 3     |
| bear | 2     |
+------+-------+
解释:
- 单词 "bull" 在 "draft1.txt" 中出现1次,在 "draft2.txt" 中出现 1 次,在 "draft3.txt" 中出现 1 次。因此,单词 "bull" 出现在 3 个文件中。
- 单词 "bear" 在 "draft2.txt" 中出现1次,在 "draft3.txt" 中出现 1 次。因此,单词 "bear" 出现在 2 个文件中。
1
2
3
4
5
6
7
8
import pandas as pd

def count_occurrences(files: pd.DataFrame) -> pd.DataFrame:
    return pd.DataFrame(
        {'word':['bull', 'bear'],
        'count':[files['content'].str.contains(r'\sbull\s').sum(),
        files['content'].str.contains(r'\sbear\s').sum()]}
    )
\s表示空格。
数据操作
177. 第N高的薪水
表: Employee
1
2
3
4
5
6
7
8
+-------------+------+
| Column Name | Type |
+-------------+------+
| id          | int  |
| salary      | int  |
+-------------+------+
在 SQL 中,id 是该表的主键。
该表的每一行都包含有关员工工资的信息。
查询 Employee 表中第 n 高的工资。如果没有第 n 个最高工资,查询结果应该为 null 。
查询结果格式如下所示。
示例 1:
1
2
3
4
5
6
7
8
9
10
11
12
13
14
15
16
输入:
Employee table:
+----+--------+
| id | salary |
+----+--------+
| 1  | 100    |
| 2  | 200    |
| 3  | 300    |
+----+--------+
n = 2
输出:
+------------------------+
| getNthHighestSalary(2) |
+------------------------+
| 200                    |
+------------------------+
示例 2:
1
2
3
4
5
6
7
8
9
10
11
12
13
14
输入:
Employee 表:
+----+--------+
| id | salary |
+----+--------+
| 1  | 100    |
+----+--------+
n = 2
输出:
+------------------------+
| getNthHighestSalary(2) |
+------------------------+
| null                   |
+------------------------+
我的答案:(改了好多次)
1
2
3
4
5
6
7
8
9
import pandas as pd

def nth_highest_salary(employee: pd.DataFrame, N: int) -> pd.DataFrame:
    distinct_salaries = employee['salary'].drop_duplicates().sort_values(ascending=False)
    if N <= 0 or N > len(distinct_salaries):  #Simplified condition
        res = None
    else:
        res = distinct_salaries.iloc[N - 1]
    return pd.DataFrame(data=[res], columns=[f'getNthHighestSalary({N})'])
176. 第二高的薪水
Employee 表:
1
2
3
4
5
6
7
8
+-------------+------+
| Column Name | Type |
+-------------+------+
| id          | int  |
| salary      | int  |
+-------------+------+
id 是这个表的主键。
表的每一行包含员工的工资信息。
查询并返回 Employee 表中第二高的 不同 薪水 。如果不存在第二高的薪水,查询应该返回 null(Pandas 则返回 None) 。
查询结果如下例所示。
示例 1:
1
2
3
4
5
6
7
8
9
10
11
12
13
14
15
输入:
Employee 表:
+----+--------+
| id | salary |
+----+--------+
| 1  | 100    |
| 2  | 200    |
| 3  | 300    |
+----+--------+
输出:
+---------------------+
| SecondHighestSalary |
+---------------------+
| 200                 |
+---------------------+
示例 2:
1
2
3
4
5
6
7
8
9
10
11
12
13
输入:
Employee 表:
+----+--------+
| id | salary |
+----+--------+
| 1  | 100    |
+----+--------+
输出:
+---------------------+
| SecondHighestSalary |
+---------------------+
| null                |
+---------------------+
只不过就是前一题变成了N=2的特殊情况:
1
2
3
4
5
6
7
8
9
import pandas as pd

def second_highest_salary(employee: pd.DataFrame) -> pd.DataFrame:
    sorted_salary = employee['salary'].drop_duplicates().sort_values( ascending=False)
    if  len(sorted_salary) < 2 :
        res = None
    else:
        res = sorted_salary.iloc[1]
    return pd.DataFrame(columns=['SecondHighestSalary'], data = [res])
184. 部门工资最高的员工
表: Employee
1
2
3
4
5
6
7
8
9
10
11
+--------------+---------+
| 列名          | 类型    |
+--------------+---------+
| id           | int     |
| name         | varchar |
| salary       | int     |
| departmentId | int     |
+--------------+---------+
在 SQL 中,id是此表的主键。
departmentId 是 Department 表中 id 的外键(在 Pandas 中称为 join key)。
此表的每一行都表示员工的 id、姓名和工资。它还包含他们所在部门的 id。
表: Department
1
2
3
4
5
6
7
8
+-------------+---------+
| 列名         | 类型    |
+-------------+---------+
| id          | int     |
| name        | varchar |
+-------------+---------+
在 SQL 中,id 是此表的主键列。
此表的每一行都表示一个部门的 id 及其名称。
查找出每个部门中薪资最高的员工。 按 任意顺序 返回结果表。 查询结果格式如下例所示。
示例 1:
1
2
3
4
5
6
7
8
9
10
11
12
13
14
15
16
17
18
19
20
21
22
23
24
25
26
27
输入:
Employee 表:
+----+-------+--------+--------------+
| id | name  | salary | departmentId |
+----+-------+--------+--------------+
| 1  | Joe   | 70000  | 1            |
| 2  | Jim   | 90000  | 1            |
| 3  | Henry | 80000  | 2            |
| 4  | Sam   | 60000  | 2            |
| 5  | Max   | 90000  | 1            |
+----+-------+--------+--------------+
Department 表:
+----+-------+
| id | name  |
+----+-------+
| 1  | IT    |
| 2  | Sales |
+----+-------+
输出:
+------------+----------+--------+
| Department | Employee | Salary |
+------------+----------+--------+
| IT         | Jim      | 90000  |
| Sales      | Henry    | 80000  |
| IT         | Max      | 90000  |
+------------+----------+--------+
解释:Max 和 Jim 在 IT 部门的工资都是最高的,Henry 在销售部的工资最高。
这道题我将调试部分也附上代码:
1
2
3
4
5
6
7
8
9
10
11
12
13
14
15
16
17
18
19
20
21
22
23
24
25
26
27
28
29
30
31
32
33
34
import pandas as pd
# Employee DataFrame
employee_data = {'id': [1, 2, 3, 4, 5],
'name': ['Joe', 'Jim', 'Henry', 'Sam', 'Max'],
'salary': [70000, 90000, 80000, 60000, 90000],
'departmentId': [1, 1, 2, 2, 1]}
employee = pd.DataFrame(employee_data)
# Department DataFrame
department_data = {'id': [1, 2],
'name': ['IT', 'Sales']}
Department = pd.DataFrame(department_data)
Department = Department.rename(
columns={
'id':'departmentId',
'name':'Department'
}
)
employee = employee.rename(
columns={
'name':'Employee',
'salary':'Salary'
}
)
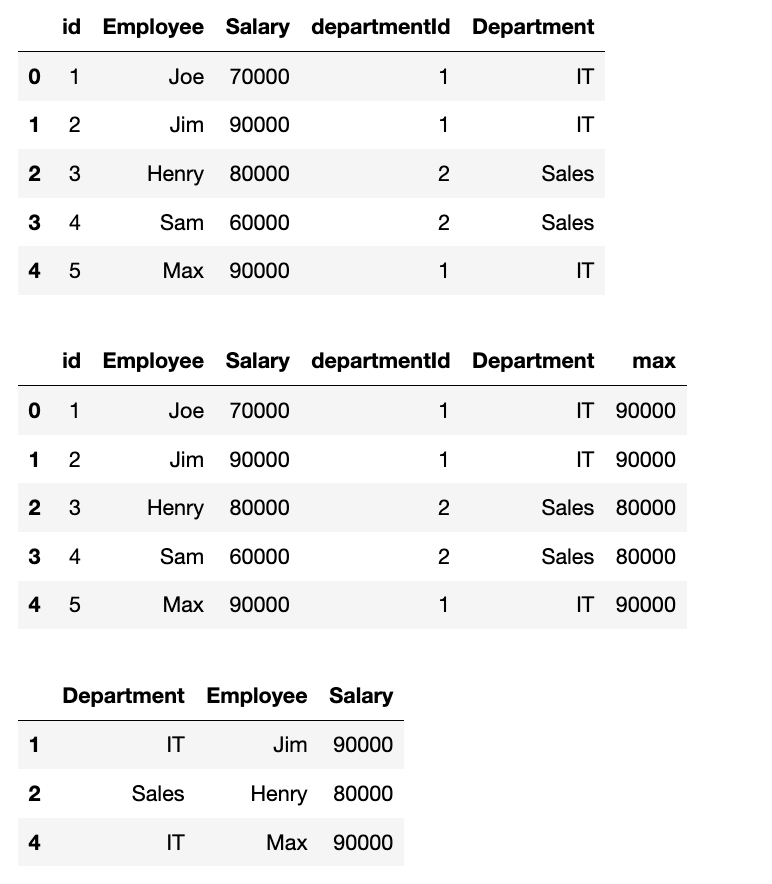
merge_table = pd.merge(employee, Department, on='departmentId')
display(merge_table)
merge_table['max'] = merge_table.groupby('departmentId')['Salary'].transform('max')
display(merge_table)
merge_table[merge_table['max'] == merge_table['Salary']][['Department', 'Employee', 'Salary']]
关于transform函数,可以复习:返回与输入组具有相同形状的结果的transform函数
题解答案是:
1
2
3
4
5
6
7
8
9
10
11
12
13
14
15
16
17
18
19
import pandas as pd

def department_highest_salary(employee: pd.DataFrame, department: pd.DataFrame) -> pd.DataFrame:
    department = department.rename(
        columns={
            'id':'departmentId',
            'name':'Department'
        }
    )
    employee = employee.rename(
        columns={
            'name':'Employee',
            'salary':'Salary'
        }
    )
    merge_table = pd.merge(employee, department, on='departmentId')
    merge_table['max'] = merge_table.groupby('departmentId')['Salary'].transform('max')
    return merge_table[merge_table['max'] == merge_table['Salary']][['Department', 'Employee', 'Salary']]
178. 分数排名
表: Scores
1
2
3
4
5
6
7
8
+-------------+---------+
| Column Name | Type    |
+-------------+---------+
| id          | int     |
| score       | decimal |
+-------------+---------+
id 是该表的主键(有不同值的列)。
该表的每一行都包含了一场比赛的分数。Score 是一个有两位小数点的浮点值。
编写一个解决方案来查询分数的排名。排名按以下规则计算:
- 分数应按从高到低排列。
- 如果两个分数相等,那么两个分数的排名应该相同。
- 在排名相同的分数后,排名数应该是下一个连续的整数。换句话说,排名之间不应该有空缺的数字。
按 score 降序返回结果表。
查询结果格式如下所示。
示例 1:
1
2
3
4
5
6
7
8
9
10
11
12
13
14
15
16
17
18
19
20
21
22
23
输入:
Scores 表:
+----+-------+
| id | score |
+----+-------+
| 1  | 3.50  |
| 2  | 3.65  |
| 3  | 4.00  |
| 4  | 3.85  |
| 5  | 4.00  |
| 6  | 3.65  |
+----+-------+
输出:
+-------+------+
| score | rank |
+-------+------+
| 4.00  | 1    |
| 4.00  | 1    |
| 3.85  | 2    |
| 3.65  | 3    |
| 3.65  | 3    |
| 3.50  | 4    |
+-------+------+
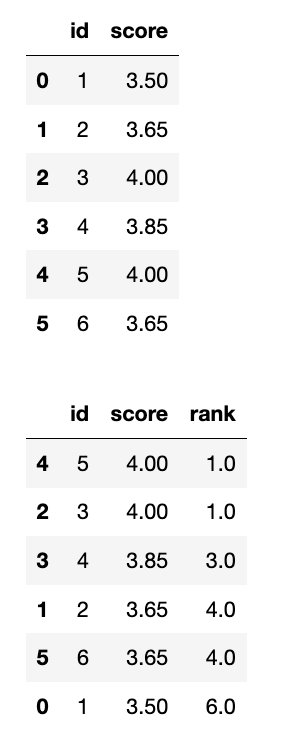
这道题我研究了一下rank函数的参数,最终机缘巧合居然做出来了:
1
2
3
4
5
6
7
import pandas as pd
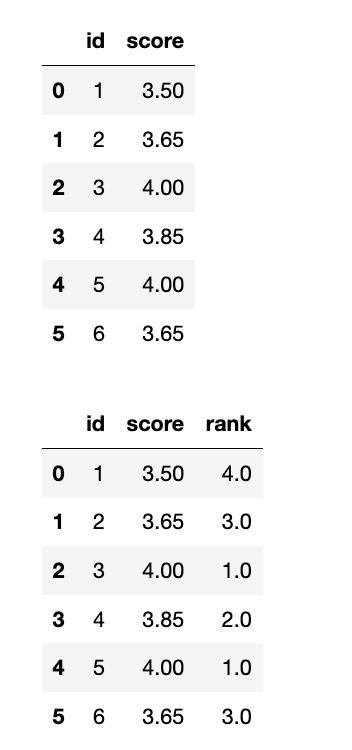
def order_scores(scores: pd.DataFrame) -> pd.DataFrame:
scores['rank'] = scores['score'].rank(ascending=False, method='dense')
scores['rank'] = scores['rank'].apply(lambda x: int(x))
sorted_df = scores.sort_values(by='score', ascending=False)
return sorted_df[['score', 'rank']]
补充:df['rank'] = df['score'].rank(ascending=False, method='dense')中的method参数:
1
df['rank'] = df['score'].rank(ascending=False, method='dense')
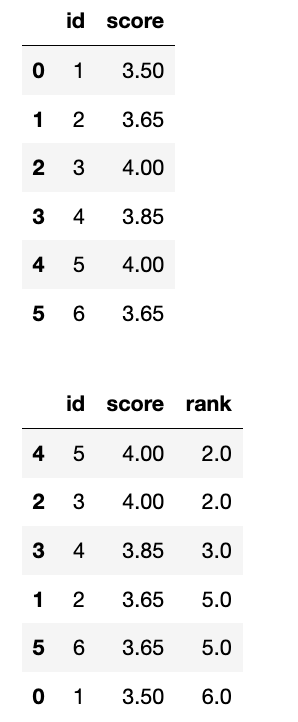
average是默认参数:
1
2
3
display(df)
df['rank'] = df['score'].rank(ascending=False, method='average')
display(df.sort_values(by='score', ascending=False))
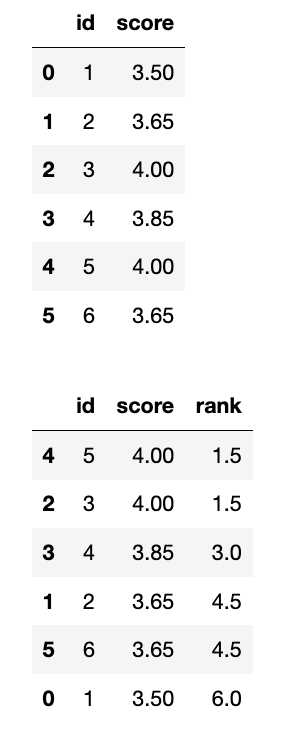
补充:前面的1.5是这么算的:
应该是排名1和2,但是不分前后,所以(1+2)/2=1.5
1
2
3
display(df)
df['rank'] = df['score'].rank(ascending=False, method='min')
display(df.sort_values(by='score', ascending=False))
1
2
3
display(df)
df['rank'] = df['score'].rank(ascending=False, method='max')
display(df.sort_values(by='score', ascending=False))
1
2
3
display(df)
df['rank'] = df['score'].rank(ascending=False, method='first')
display(df.sort_values(by='score', ascending=False))

- method: 指定如何处理平局 (相同的值)。这是 rank() 函数最重要的参数之一。 选项包括:
- ‘average’ (默认): 将平均排名分配给每个平局组中的值。
- ‘min’: 将最小的排名分配给每个平局组中的值。
- ‘max’: 将最大的排名分配给每个平局组中的值。
- ‘first’: 按照值在数据中出现的顺序分配排名。
- ‘dense’: 类似于 ‘min’,但排名之间没有间隔。即,下一个非平局值将获得紧随其后的排名。
rank常见的三种排序方式
- First 顺序排名,1,2,3,4,5
- Min 跳跃排名,1,2,2,4,5(并列2/3名,取小的2)
- Dense 密集排名,1,2,2,3,4
196. 删除重复的电子邮箱
表: Person
1
2
3
4
5
6
7
8
+-------------+---------+
| Column Name | Type    |
+-------------+---------+
| id          | int     |
| email       | varchar |
+-------------+---------+
id 是该表的主键列(具有唯一值的列)。
该表的每一行包含一封电子邮件。电子邮件将不包含大写字母。
编写解决方案 删除 所有重复的电子邮件,只保留一个具有最小 id 的唯一电子邮件。
(对于 SQL 用户,请注意你应该编写一个 DELETE 语句而不是 SELECT 语句。)
(对于 Pandas 用户,请注意你应该直接修改 Person 表。)
运行脚本后,显示的答案是 Person 表。驱动程序将首先编译并运行您的代码片段,然后再显示 Person 表。Person 表的最终顺序 无关紧要 。
返回结果格式如下示例所示。
示例 1:
1
2
3
4
5
6
7
8
9
10
11
12
13
14
15
16
17
输入:
Person 表:
+----+------------------+
| id | email            |
+----+------------------+
| 1  | john@example.com |
| 2  | bob@example.com  |
| 3  | john@example.com |
+----+------------------+
输出:
+----+------------------+
| id | email            |
+----+------------------+
| 1  | john@example.com |
| 2  | bob@example.com  |
+----+------------------+
解释: john@example.com重复两次。我们保留最小的Id = 1。
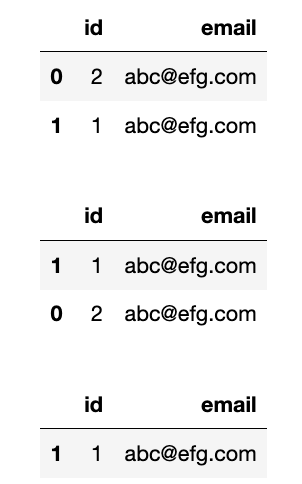
这题多少有点脱裤子放屁了,就为了强调用inplace=True,而且用2次 , 用返回值再赋值都不行
1
2
3
4
5
6
7
8
9
10
11
12
13
14
# Person 表:
# | id | email       |
# | -- | ----------- |
# | 2  | abc@efg.com |
# | 1  | abc@efg.com |

data = {'id':[2, 1], 'email':['abc@efg.com', 'abc@efg.com']}
person = pd.DataFrame(data)
display(person)

person = person.sort_values(by='id')
display(person)
person = person.drop_duplicates(subset=['email'], keep='first')
display(person)
1795. 每个产品在不同商店的价格
表:Products
1
2
3
4
5
6
7
8
9
10
11
+-------------+---------+
| Column Name | Type    |
+-------------+---------+
| product_id  | int     |
| store1      | int     |
| store2      | int     |
| store3      | int     |
+-------------+---------+
在 SQL 中,这张表的主键是 product_id(产品Id)。
每行存储了这一产品在不同商店 store1, store2, store3 的价格。
如果这一产品在商店里没有出售,则值将为 null。
请你重构 Products 表,查询每个产品在不同商店的价格,使得输出的格式变为(product_id, store, price) 。如果这一产品在商店里没有出售,则不输出这一行。
输出结果表中的 顺序不作要求 。
查询输出格式请参考下面示例。
示例 1:
1
2
3
4
5
6
7
8
9
10
11
12
13
14
15
16
17
18
19
20
21
输入:
Products table:
+------------+--------+--------+--------+
| product_id | store1 | store2 | store3 |
+------------+--------+--------+--------+
| 0          | 95     | 100    | 105    |
| 1          | 70     | null   | 80     |
+------------+--------+--------+--------+
输出:
+------------+--------+-------+
| product_id | store  | price |
+------------+--------+-------+
| 0          | store1 | 95    |
| 0          | store2 | 100   |
| 0          | store3 | 105   |
| 1          | store1 | 70    |
| 1          | store3 | 80    |
+------------+--------+-------+
解释:
产品 0 在 store1、store2、store3 的价格分别为 95、100、105。
产品 1 在 store1、store3 的价格分别为 70、80。在 store2 无法买到。
1
2
3
4
5
import pandas as pd

def rearrange_products_table(products: pd.DataFrame) -> pd.DataFrame:
    df_melted = products.melt(id_vars=['product_id'], value_vars=['store1', 'store2', 'store3'],var_name='store', value_name='price')
    return df_melted.dropna(subset=['price'])
关于pandas中重塑的大师—— melt函数,更多的介绍、总结、记忆方法和练习参考博客:df长宽变形大师 - melt的重塑神功
数据统计
2082. 富有客户的数量
表: Store
1
2
3
4
5
6
7
8
9
+-------------+------+
| Column Name | Type |
+-------------+------+
| bill_id     | int  |
| customer_id | int  |
| amount      | int  |
+-------------+------+
bill_id 是这个表的主键(具有唯一值的列)。
每一行包含一个订单的金额及相关客户的信息。
编写解决方案找出 至少有一个 订单的金额 严格大于 500 的客户的数量。
返回结果格式如下示例所示:
示例 1:
1
2
3
4
5
6
7
8
9
10
11
12
13
14
15
16
17
18
19
20
21
输入:
Store 表:
+---------+-------------+--------+
| bill_id | customer_id | amount |
+---------+-------------+--------+
| 6       | 1           | 549    |
| 8       | 1           | 834    |
| 4       | 2           | 394    |
| 11      | 3           | 657    |
| 13      | 3           | 257    |
+---------+-------------+--------+
输出:
+------------+
| rich_count |
+------------+
| 2          |
+------------+
解释:
客户 1 有 2 个订单金额严格大于 500。
客户 2 没有任何订单金额严格大于 500。
客户 3 有 1 个订单金额严格大于 500。
我写的答案:
1
2
3
4
5
import pandas as pd

def count_rich_customers(store: pd.DataFrame) -> pd.DataFrame:
    res = [(i[1]['amount'] > 500).any() for i in store.groupby('customer_id')]
    return pd.DataFrame({'rich_count': sum(res)}, index=[0])
可以通过。
官方的答案:
1
2
3
4
5
6
7
8
9
10
11
import pandas as pd

def count_rich_customers(store: pd.DataFrame) -> pd.DataFrame:
    rich_customers = store[store['amount'] > 500]

    count = rich_customers['customer_id'].nunique()

    answer = pd.DataFrame({'rich_count':[count]})

    return answer
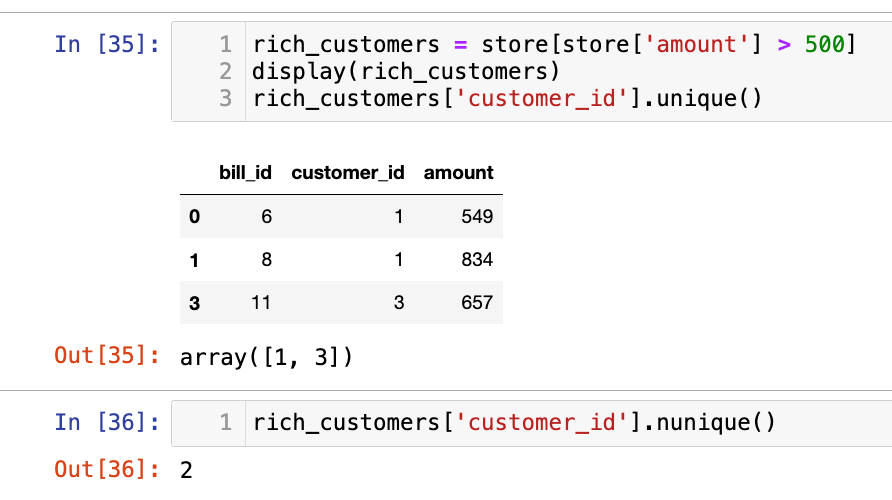
学到一个新函数:nunique统计unique的个数的。
1173. 即时食物配送 I
配送表: Delivery
1
2
3
4
5
6
7
8
9
10
+-----------------------------+---------+
| Column Name                 | Type    |
+-----------------------------+---------+
| delivery_id                 | int     |
| customer_id                 | int     |
| order_date                  | date    |
| customer_pref_delivery_date | date    |
+-----------------------------+---------+
delivery_id 是表的主键(具有唯一值的列)。
该表保存着顾客的食物配送信息,顾客在某个日期下了订单,并指定了一个期望的配送日期(和下单日期相同或者在那之后)。
如果顾客期望的配送日期和下单日期相同,则该订单称为 「即时订单」,否则称为「计划订单」。
编写解决方案统计即时订单所占的百分比, 保留两位小数。
返回结果如下所示。
示例 1:
1
2
3
4
5
6
7
8
9
10
11
12
13
14
15
16
17
18
19
输入:
Delivery 表:
+-------------+-------------+------------+-----------------------------+
| delivery_id | customer_id | order_date | customer_pref_delivery_date |
+-------------+-------------+------------+-----------------------------+
| 1           | 1           | 2019-08-01 | 2019-08-02                  |
| 2           | 5           | 2019-08-02 | 2019-08-02                  |
| 3           | 1           | 2019-08-11 | 2019-08-11                  |
| 4           | 3           | 2019-08-24 | 2019-08-26                  |
| 5           | 4           | 2019-08-21 | 2019-08-22                  |
| 6           | 2           | 2019-08-11 | 2019-08-13                  |
+-------------+-------------+------------+-----------------------------+
输出:
+----------------------+
| immediate_percentage |
+----------------------+
| 33.33                |
+----------------------+
解释:2 和 3 号订单为即时订单,其他的为计划订单。
本题测试数据:
1
2
3
4
5
6
7
8
9
10
11
12
13
14
15
16
17
18
19
20
21
# 数据
data = {
    'delivery_id': [1, 2, 3, 4, 5, 6],
    'customer_id': [1, 5, 1, 3, 4, 2],
    'order_date': ['2019-08-01', '2019-08-02', '2019-08-11', '2019-08-24', '2019-08-21', '2019-08-11'],
    'customer_pref_delivery_date': ['2019-08-02', '2019-08-02', '2019-08-11', '2019-08-26', '2019-08-22', '2019-08-13']
}

# 创建 DataFrame
delivery = pd.DataFrame(data)

# 将日期字符串转换为 datetime 对象
delivery['order_date'] = pd.to_datetime(delivery['order_date'])
delivery['customer_pref_delivery_date'] = pd.to_datetime(delivery['customer_pref_delivery_date'])

display(delivery)
print(delivery.dtypes)


rate = sum(delivery['order_date'] == delivery['customer_pref_delivery_date'])/len(delivery)
pd.DataFrame({'immediate_percentage':[rate]})
我写的答案:
1
2
3
4
5
import pandas as pd

def food_delivery(delivery: pd.DataFrame) -> pd.DataFrame:
    rate = sum(delivery['order_date'] == delivery['customer_pref_delivery_date'])/len(delivery)
    return pd.DataFrame({'immediate_percentage':[round(rate*100, 2)]})
1907. 按分类统计薪水
表: Accounts
1
2
3
4
5
6
7
8
+-------------+------+
| 列名        | 类型  |
+-------------+------+
| account_id  | int  |
| income      | int  |
+-------------+------+
在 SQL 中,account_id 是这个表的主键。
每一行都包含一个银行帐户的月收入的信息。
查询每个工资类别的银行账户数量。 工资类别如下:
"Low Salary":所有工资 严格低于20000美元。"Average Salary": 包含 范围内的所有工资[$20000, $50000]。"High Salary":所有工资 严格大于50000美元。
结果表 必须 包含所有三个类别。 如果某个类别中没有帐户,则报告 0 。
按 任意顺序 返回结果表。
查询结果格式如下示例。
示例 1:
1
2
3
4
5
6
7
8
9
10
11
12
13
14
15
16
17
18
19
20
21
22
输入:
Accounts 表:
+------------+--------+
| account_id | income |
+------------+--------+
| 3          | 108939 |
| 2          | 12747  |
| 8          | 87709  |
| 6          | 91796  |
+------------+--------+
输出:
+----------------+----------------+
| category       | accounts_count |
+----------------+----------------+
| Low Salary     | 1              |
| Average Salary | 0              |
| High Salary    | 3              |
+----------------+----------------+
解释:
低薪: 有一个账户 2.
中等薪水: 没有.
高薪: 有三个账户,他们是 3, 6和 8.
测试数据:
1
2
3
4
5
# 数据
data = {
    'account_id': [3, 2, 8, 6],
    'income': [108939, 12747, 87709, 91796]
}
我的答案:
1
2
3
4
5
6
7
import pandas as pd

def count_salary_categories(accounts: pd.DataFrame) -> pd.DataFrame:
    l = (accounts['income'] < 20000).sum()
    a = ((20000 <= accounts['income']) &  (accounts['income'] <= 50000)).sum()
    h = (accounts['income'] > 50000).sum()
    return pd.DataFrame({'category':['Low Salary', 'Average Salary', 'High Salary'], 'accounts_count':[l, a, h]})
答案和我写的类似。
测验题
1322. 广告效果
表: Ads
1
2
3
4
5
6
7
8
9
10
+---------------+---------+
| Column Name   | Type    |
+---------------+---------+
| ad_id         | int     |
| user_id       | int     |
| action        | enum    |
+---------------+---------+
(ad_id, user_id) 是该表的主键(具有唯一值的列的组合)
该表的每一行包含一条广告的 ID(ad_id),用户的 ID(user_id) 和用户对广告采取的行为 (action)
action 列是一个枚举类型 ('Clicked', 'Viewed', 'Ignored') 。
一家公司正在运营这些广告并想计算每条广告的效果。
广告效果用点击通过率(Click-Through Rate:CTR)来衡量,公式如下:

编写解决方案找出每一条广告的 ctr ,ctr 要 保留两位小数 。
返回结果需要按 ctr 降序、按 ad_id 升序 进行排序。
返回结果示例如下:
示例 1:
1
2
3
4
5
6
7
8
9
10
11
12
13
14
15
16
17
18
19
20
21
22
23
24
25
26
27
28
29
30
31
输入:
Ads 表:
+-------+---------+---------+
| ad_id | user_id | action  |
+-------+---------+---------+
| 1     | 1       | Clicked |
| 2     | 2       | Clicked |
| 3     | 3       | Viewed  |
| 5     | 5       | Ignored |
| 1     | 7       | Ignored |
| 2     | 7       | Viewed  |
| 3     | 5       | Clicked |
| 1     | 4       | Viewed  |
| 2     | 11      | Viewed  |
| 1     | 2       | Clicked |
+-------+---------+---------+
输出:
+-------+-------+
| ad_id | ctr   |
+-------+-------+
| 1     | 66.67 |
| 3     | 50.00 |
| 2     | 33.33 |
| 5     | 0.00  |
+-------+-------+
解释:
对于 ad_id = 1, ctr = (2/(2+1)) * 100 = 66.67
对于 ad_id = 2, ctr = (1/(1+2)) * 100 = 33.33
对于 ad_id = 3, ctr = (1/(1+1)) * 100 = 50.00
对于 ad_id = 5, ctr = 0.00, 注意 ad_id = 5 没有被点击 (Clicked) 或查看 (Viewed) 过
注意我们不关心 action 为 Ingnored 的广告
测试数据:
1
2
3
4
5
data = {
    'ad_id': [1, 2, 3, 5, 1, 2, 3, 1, 2, 1],
    'user_id': [1, 2, 3, 5, 7, 7, 5, 4, 11, 2],
    'action': ['Clicked', 'Clicked', 'Viewed', 'Ignored', 'Ignored', 'Viewed', 'Clicked', 'Viewed', 'Viewed', 'Clicked']
}
我写的答案:(时间复杂度略大):
1
2
3
4
5
6
7
8
9
10
11
import pandas as pd

def ads_performance(ads: pd.DataFrame) -> pd.DataFrame:
    ad_id = ads['ad_id'].unique()
    ctr = []
    for id in ad_id:
        ads_i = ads[ads['ad_id'] == id]
        clicked = (ads_i['action'] == 'Clicked').sum()
        viewed = (ads_i['action'] == 'Viewed').sum()
        ctr.append(0 if clicked + viewed == 0 else round(100*clicked/(clicked + viewed), 2))
    return pd.DataFrame({'ad_id':ad_id, 'ctr':ctr}).sort_values(by=['ctr', 'ad_id'], ascending=[False, True])
数据分组
1741. 查找每个员工花费的总时间
表: Employees
1
2
3
4
5
6
7
8
9
10
11
12
13
+-------------+------+
| Column Name | Type |
+-------------+------+
| emp_id      | int  |
| event_day   | date |
| in_time     | int  |
| out_time    | int  |
+-------------+------+
在 SQL 中,(emp_id, event_day, in_time) 是这个表的主键。
该表显示了员工在办公室的出入情况。
event_day 是此事件发生的日期,in_time 是员工进入办公室的时间,而 out_time 是他们离开办公室的时间。
in_time 和 out_time 的取值在1到1440之间。
题目保证同一天没有两个事件在时间上是相交的,并且保证 in_time 小于 out_time。
计算每位员工每天在办公室花费的总时间(以分钟为单位)。 请注意,在一天之内,同一员工是可以多次进入和离开办公室的。 在办公室里一次进出所花费的时间为out_time 减去 in_time。
返回结果表单的顺序无要求。 查询结果的格式如下:
示例 1:
1
2
3
4
5
6
7
8
9
10
11
12
13
14
15
16
17
18
19
20
21
22
23
输入:
Employees table:
+--------+------------+---------+----------+
| emp_id | event_day  | in_time | out_time |
+--------+------------+---------+----------+
| 1      | 2020-11-28 | 4       | 32       |
| 1      | 2020-11-28 | 55      | 200      |
| 1      | 2020-12-03 | 1       | 42       |
| 2      | 2020-11-28 | 3       | 33       |
| 2      | 2020-12-09 | 47      | 74       |
+--------+------------+---------+----------+
输出:
+------------+--------+------------+
| day        | emp_id | total_time |
+------------+--------+------------+
| 2020-11-28 | 1      | 173        |
| 2020-11-28 | 2      | 30         |
| 2020-12-03 | 1      | 41         |
| 2020-12-09 | 2      | 27         |
+------------+--------+------------+
解释:
雇员 1 有三次进出: 有两次发生在 2020-11-28 花费的时间为 (32 - 4) + (200 - 55) = 173, 有一次发生在 2020-12-03 花费的时间为 (42 - 1) = 41。
雇员 2 有两次进出: 有一次发生在 2020-11-28 花费的时间为 (33 - 3) = 30,  有一次发生在 2020-12-09 花费的时间为 (74 - 47) = 27。
测试数据:
1
2
3
4
data = {'emp_id': [1, 1, 1, 2, 2],
        'event_day': ['2020-11-28', '2020-11-28', '2020-12-03', '2020-11-28', '2020-12-09'],
        'in_time': [4, 55, 1, 3, 47],
        'out_time': [32, 200, 42, 33, 74]}
我的答案:
1
2
3
4
5
6
7
8
import pandas as pd

def total_time(employees: pd.DataFrame) -> pd.DataFrame:
    employees['total'] = employees['out_time'] - employees['in_time']
    employees['total_time'] = employees.groupby(['emp_id', 'event_day'])['total'].transform('sum')
    res = employees.drop_duplicates(subset=['emp_id', 'event_day'])
    res = res.rename(columns={'event_day':'day'})
    return res[['day', 'emp_id', 'total_time']]
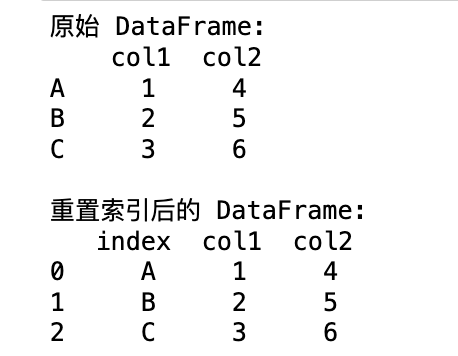
官方答案有一个函数reset_index:
1
2
3
4
5
6
7
8
9
10
11
12
13
import pandas as pd

# 示例 DataFrame
data = {'col1': [1, 2, 3],
        'col2': [4, 5, 6]}
df = pd.DataFrame(data, index=['A', 'B', 'C'])  # 使用自定义索引

print("原始 DataFrame:\n", df)

# 使用 reset_index()
df_reset = df.reset_index()

print("\n重置索引后的 DataFrame:\n", df_reset)
511. 游戏玩法分析 I
活动表 Activity:
1
2
3
4
5
6
7
8
9
10
11
+--------------+---------+
| Column Name  | Type    |
+--------------+---------+
| player_id    | int     |
| device_id    | int     |
| event_date   | date    |
| games_played | int     |
+--------------+---------+
在 SQL 中,表的主键是 (player_id, event_date)。
这张表展示了一些游戏玩家在游戏平台上的行为活动。
每行数据记录了一名玩家在退出平台之前,当天使用同一台设备登录平台后打开的游戏的数目(可能是 0 个)。
查询每位玩家 第一次登录平台的日期。
查询结果的格式如下所示:
1
2
3
4
5
6
7
8
9
10
11
12
13
14
15
16
17
18
19
Activity 表:
+-----------+-----------+------------+--------------+
| player_id | device_id | event_date | games_played |
+-----------+-----------+------------+--------------+
| 1         | 2         | 2016-03-01 | 5            |
| 1         | 2         | 2016-05-02 | 6            |
| 2         | 3         | 2017-06-25 | 1            |
| 3         | 1         | 2016-03-02 | 0            |
| 3         | 4         | 2018-07-03 | 5            |
+-----------+-----------+------------+--------------+

Result 表:
+-----------+-------------+
| player_id | first_login |
+-----------+-------------+
| 1         | 2016-03-01  |
| 2         | 2017-06-25  |
| 3         | 2016-03-02  |
+-----------+-------------+
测试数据:
1
2
3
4
5
6
7
8
data = {'player_id': [1, 1, 2, 3, 3],
        'device_id': [2, 2, 3, 1, 4],
        'event_date': ['2016-03-01', '2016-05-02', '2017-06-25', '2016-03-02', '2018-07-03'],
        'games_played': [5, 6, 1, 0, 5]}
data = {'player_id': [1, 3],
        'device_id': [2, 4],
        'event_date': ['2016-03-01', '2016-02-03'],
        'games_played': [5, 5]}
不知道我写的有什么问题,碰到力扣一个贼长的测试用例,懒得查为什么了。。。
1
2
3
4
5
6
import pandas as pd

def game_analysis(activity: pd.DataFrame) -> pd.DataFrame:
    activity['first_login'] = activity.groupby('player_id')['event_date'].transform('min')
    activity = activity.drop_duplicates(subset=['first_login'])
    return activity[['player_id', 'first_login']]
官方答案是:
1
2
3
4
5
6
7
import pandas as pd

def game_analysis(activity: pd.DataFrame) -> pd.DataFrame:
    df = activity.groupby('player_id')['event_date'].min().reset_index()

    return df.rename(columns = {'event_date':'first_login'})
和我写的差不多,但是有reset_index()
GPT说这两段代码会返回相同的结果,即一个 DataFrame,其中包含每个 player_id 及其对应的最早登录日期。
2356. 每位教师所教授的科目种类的数量
表: Teacher
1
2
3
4
5
6
7
8
9
+-------------+------+
| Column Name | Type |
+-------------+------+
| teacher_id  | int  |
| subject_id  | int  |
| dept_id     | int  |
+-------------+------+
在 SQL 中,(subject_id, dept_id) 是该表的主键。
该表中的每一行都表示带有 teacher_id 的教师在系 dept_id 中教授科目 subject_id。
查询每位老师在大学里教授的科目种类的数量。
以 任意顺序 返回结果表。
查询结果格式示例如下。
示例 1:
1
2
3
4
5
6
7
8
9
10
11
12
13
14
15
16
17
18
19
20
21
22
23
24
25
26
27
28
29
输入:
Teacher 表:
+------------+------------+---------+
| teacher_id | subject_id | dept_id |
+------------+------------+---------+
| 1          | 2          | 3       |
| 1          | 2          | 4       |
| 1          | 3          | 3       |
| 2          | 1          | 1       |
| 2          | 2          | 1       |
| 2          | 3          | 1       |
| 2          | 4          | 1       |
+------------+------------+---------+
输出:
+------------+-----+
| teacher_id | cnt |
+------------+-----+
| 1          | 2   |
| 2          | 4   |
+------------+-----+
解释:
教师 1:
  - 他在 3、4 系教科目 2。
  - 他在 3 系教科目 3。
教师 2:
  - 他在 1 系教科目 1。
  - 他在 1 系教科目 2。
  - 他在 1 系教科目 3。
  - 他在 1 系教科目 4。
测试数据:
1
2
3
4
5
6
data = {'teacher_id': [1, 1, 1, 2, 2, 2, 2],
        'subject_id': [2, 2, 3, 1, 2, 3, 4],
        'dept_id': [3, 4, 3, 1, 1, 1, 1]}

teacher = pd.DataFrame(data)
display(teacher)
这题我写的比较顺利:
1
2
3
4
5
6
import pandas as pd

def count_unique_subjects(teacher: pd.DataFrame) -> pd.DataFrame:
    sub = teacher.groupby('teacher_id')['subject_id'].unique().reset_index()
    sub['cnt'] = sub['subject_id'].str.len()  # .str.len() 方法来获取每个列表中元素的数量。
    return sub[['teacher_id', 'cnt']]
补充:reset_index() 在这段代码中的作用至关重要,它影响着 groupby 操作的结果以及后续计算列表长度的方式。
-
teacher.groupby('teacher_id')['subject_id'].unique(): 这一步按teacher_id分组,并获取每个教师对应的唯一subject_id列表。 结果是一个 Series,其中 teacher_id 是索引。 -
.reset_index(): 关键作用:reset_index()将索引teacher_id转换为 DataFrame 的一个普通列。 这会将 Series 转换为 DataFrame,其中包含两列:teacher_id和subject_id(包含唯一科目列表)。 这样做的目的是让teacher_id成为一个可以操作的列,而不是索引。
如果没有 reset_index(),sub 仍然是一个 Series,其中 teacher_id 是索引,而包含唯一科目列表是 Series 的值。
因为sub是Series,所以要先使用to_frame()函数转换为Dataframe,索引会默认成为Dataframe的索引
所以也可以写成:
1
2
3
4
5
6
7
import pandas as pd

def count_unique_subjects(teacher: pd.DataFrame) -> pd.DataFrame:
    sub = teacher.groupby('teacher_id')['subject_id'].unique()  # 去掉reset_index()
    sub = sub.to_frame()  # 将 Series 转换为 DataFrame, 索引成为DataFrame的索引
    sub['cnt'] = sub['subject_id'].str.len()  # .str.len() 方法来获取每个列表中元素的数量。
    return sub.rename_axis('teacher_id').reset_index()[['teacher_id', 'cnt']]
最终还是要再用reset_index()转换为列。
596. 超过 5 名学生的课
表: Courses
1
2
3
4
5
6
7
8
+-------------+---------+
| Column Name | Type    |
+-------------+---------+
| student     | varchar |
| class       | varchar |
+-------------+---------+
(student, class)是该表的主键(不同值的列的组合)。
该表的每一行表示学生的名字和他们注册的班级。
查询 至少有 5 个学生 的所有班级。
以 任意顺序 返回结果表。
结果格式如下所示。
示例 1:
1
2
3
4
5
6
7
8
9
10
11
12
13
14
15
16
17
18
19
20
21
22
23
24
25
26
输入:
Courses table:
+---------+----------+
| student | class    |
+---------+----------+
| A       | Math     |
| B       | English  |
| C       | Math     |
| D       | Biology  |
| E       | Math     |
| F       | Computer |
| G       | Math     |
| H       | Math     |
| I       | Math     |
+---------+----------+
输出:
+---------+
| class   |
+---------+
| Math    |
+---------+
解释:
-数学课有 6 个学生,所以我们包括它。
-英语课有 1 名学生,所以我们不包括它。
-生物课有 1 名学生,所以我们不包括它。
-计算机课有 1 个学生,所以我们不包括它。
测试数据:
1
2
data = {'student': ['A', 'B', 'C', 'D', 'E', 'F', 'G', 'H', 'I'],
        'class': ['Math', 'English', 'Math', 'Biology', 'Math', 'Computer', 'Math', 'Math', 'Math']}
这题经过前面这么多题目的训练,变得非常简单了:
1
2
3
4
5
import pandas as pd

def find_classes(courses: pd.DataFrame) -> pd.DataFrame:
    res = courses.groupby('class')['student'].count() .reset_index()
    return res[res['student'] >= 5][['class']]
586. 订单最多的客户
表: Orders
1
2
3
4
5
6
7
8
+-----------------+----------+
| Column Name     | Type     |
+-----------------+----------+
| order_number    | int      |
| customer_number | int      |
+-----------------+----------+
在 SQL 中,Order_number是该表的主键。
此表包含关于订单ID和客户ID的信息。
查找下了 最多订单 的客户的 customer_number 。
测试用例生成后, 恰好有一个客户 比任何其他客户下了更多的订单。
查询结果格式如下所示。
示例 1:
1
2
3
4
5
6
7
8
9
10
11
12
13
14
15
16
17
18
19
输入:
Orders 表:
+--------------+-----------------+
| order_number | customer_number |
+--------------+-----------------+
| 1            | 1               |
| 2            | 2               |
| 3            | 3               |
| 4            | 3               |
+--------------+-----------------+
输出:
+-----------------+
| customer_number |
+-----------------+
| 3               |
+-----------------+
解释:
customer_number 为 '3' 的顾客有两个订单,比顾客 '1' 或者 '2' 都要多,因为他们只有一个订单。
所以结果是该顾客的 customer_number ,也就是 3 。
测试数据:
1
2
data = {'order_number': [1, 2, 3, 4],
        'customer_number': [1, 2, 3, 3]}
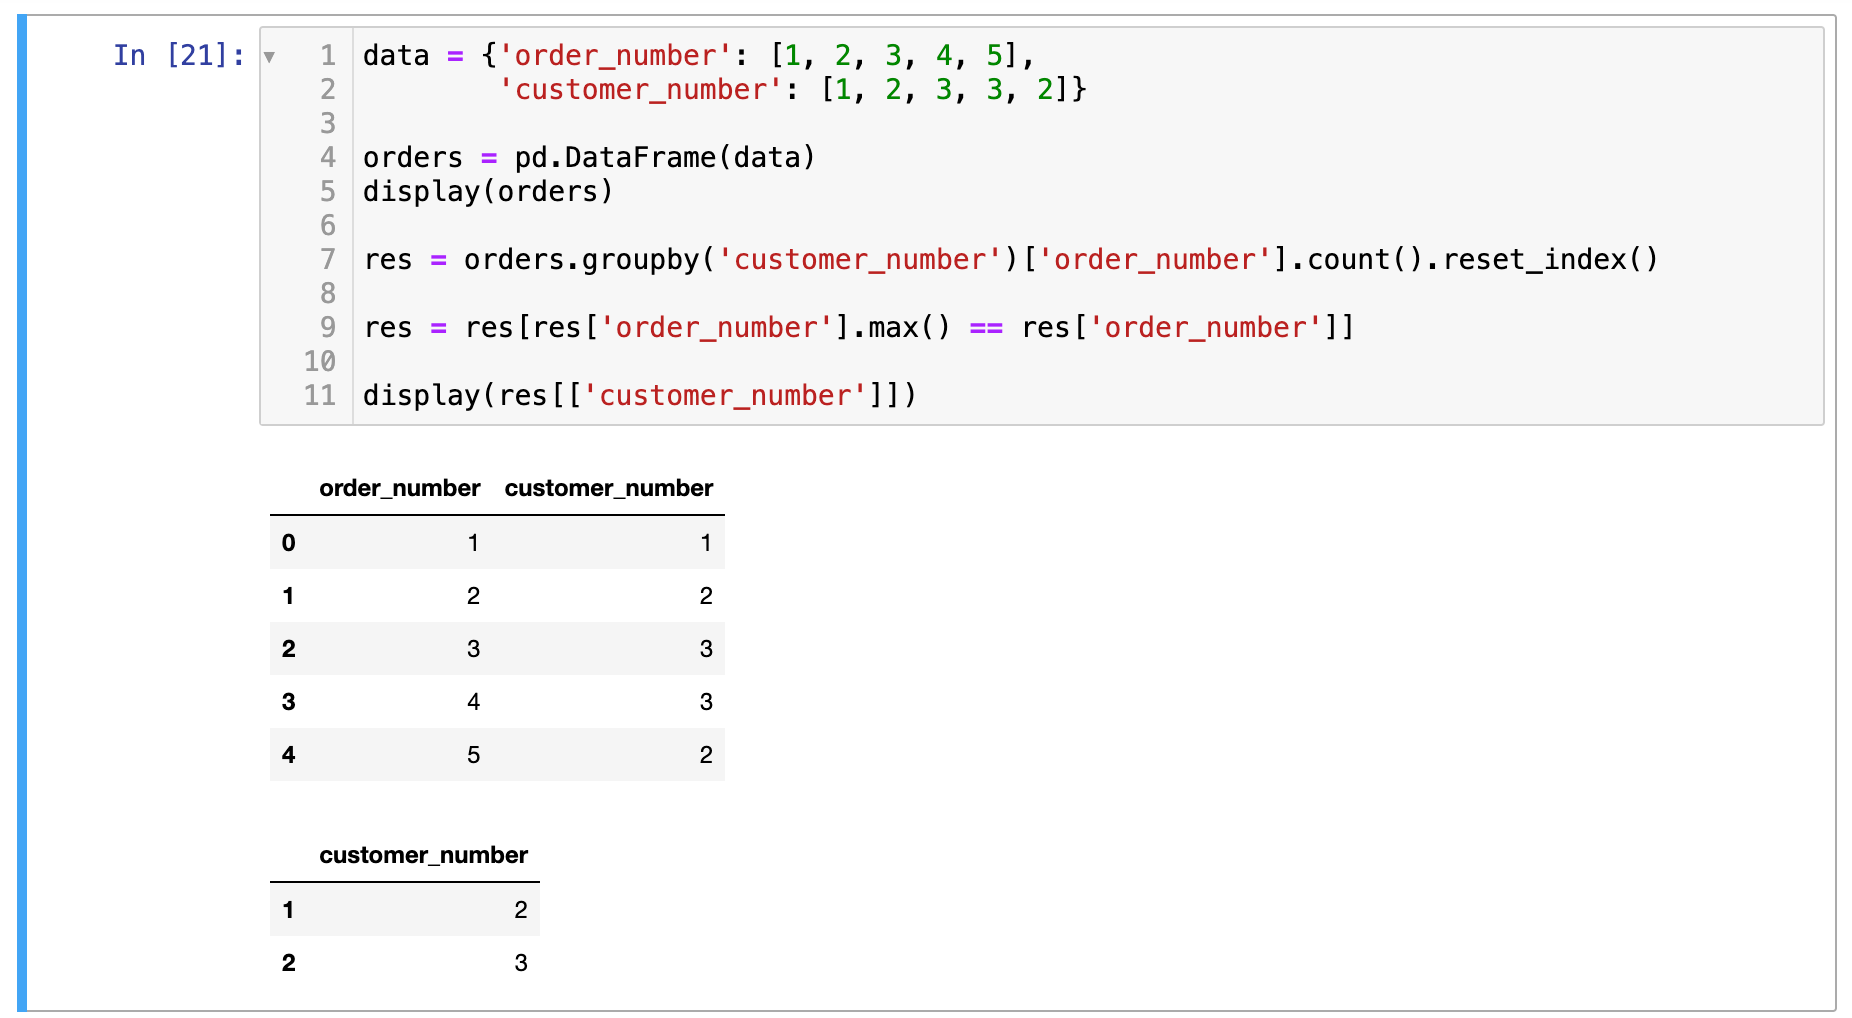
我的答案:
1
2
3
4
5
6
import pandas as pd

def largest_orders(orders: pd.DataFrame) -> pd.DataFrame:
    res = orders.groupby('customer_number')['order_number'].count().reset_index()
    res = res[res['order_number'].max() == res['order_number']]
    return res[['customer_number']]
进阶: 如果有多位顾客订单数并列最多,你能找到他们所有的 customer_number 吗?
用我上面的解法也没问题啊:
1484. 按日期分组销售产品
表 Activities:
1
2
3
4
5
6
7
8
+-------------+---------+
| 列名         | 类型    |
+-------------+---------+
| sell_date   | date    |
| product     | varchar |
+-------------+---------+
该表没有主键(具有唯一值的列)。它可能包含重复项。
此表的每一行都包含产品名称和在市场上销售的日期。
编写解决方案找出每个日期、销售的不同产品的数量及其名称。
每个日期的销售产品名称应按词典序排列。
返回按 sell_date 排序的结果表。
结果表结果格式如下例所示。
示例 1:
1
2
3
4
5
6
7
8
9
10
11
12
13
14
15
16
17
18
19
20
21
22
23
24
25
输入:
Activities 表:
+------------+-------------+
| sell_date  | product     |
+------------+-------------+
| 2020-05-30 | Headphone   |
| 2020-06-01 | Pencil      |
| 2020-06-02 | Mask        |
| 2020-05-30 | Basketball  |
| 2020-06-01 | Bible       |
| 2020-06-02 | Mask        |
| 2020-05-30 | T-Shirt     |
+------------+-------------+
输出:
+------------+----------+------------------------------+
| sell_date  | num_sold | products                     |
+------------+----------+------------------------------+
| 2020-05-30 | 3        | Basketball,Headphone,T-shirt |
| 2020-06-01 | 2        | Bible,Pencil                 |
| 2020-06-02 | 1        | Mask                         |
+------------+----------+------------------------------+
解释:
对于2020-05-30,出售的物品是 (Headphone, Basketball, T-shirt),按词典序排列,并用逗号 ',' 分隔。
对于2020-06-01,出售的物品是 (Pencil, Bible),按词典序排列,并用逗号分隔。
对于2020-06-02,出售的物品是 (Mask),只需返回该物品名。
测试数据:
1
2
data = {'sell_date': ['2020-05-30', '2020-06-01', '2020-06-02', '2020-05-30', '2020-06-01', '2020-06-02', '2020-05-30'],
        'product': ['Headphone', 'Pencil', 'Mask', 'Basketball', 'Bible', 'Mask', 'T-Shirt']}
这道题的类型我还没有结束过。用了gpt,下面的写法太强了:
1
2
3
4
5
6
7
8
9
import pandas as pd

def categorize_products(activities: pd.DataFrame) -> pd.DataFrame:
    res = activities.groupby('sell_date')['product'].agg(['nunique', lambda x: ','.join(sorted(x.unique()))]).reset_index()
    res = res.rename(columns={
        'nunique':'num_sold',
        '<lambda_0>':'products'
    })
    return res
1693. 每天的领导和合伙人
表:DailySales
1
2
3
4
5
6
7
8
9
10
11
+-------------+---------+
| Column Name | Type    |
+-------------+---------+
| date_id     | date    |
| make_name   | varchar |
| lead_id     | int     |
| partner_id  | int     |
+-------------+---------+
该表没有主键(具有唯一值的列)。它可能包含重复项。
该表包含日期、产品的名称,以及售给的领导和合伙人的编号。
名称只包含小写英文字母。
对于每一个 date_id 和 make_name,找出 不同 的 lead_id 以及 不同 的 partner_id 的数量。
按 任意顺序 返回结果表。
返回结果格式如下示例所示。
示例 1:
1
2
3
4
5
6
7
8
9
10
11
12
13
14
15
16
17
18
19
20
21
22
23
24
25
26
27
28
输入:
DailySales 表:
+-----------+-----------+---------+------------+
| date_id   | make_name | lead_id | partner_id |
+-----------+-----------+---------+------------+
| 2020-12-8 | toyota    | 0       | 1          |
| 2020-12-8 | toyota    | 1       | 0          |
| 2020-12-8 | toyota    | 1       | 2          |
| 2020-12-7 | toyota    | 0       | 2          |
| 2020-12-7 | toyota    | 0       | 1          |
| 2020-12-8 | honda     | 1       | 2          |
| 2020-12-8 | honda     | 2       | 1          |
| 2020-12-7 | honda     | 0       | 1          |
| 2020-12-7 | honda     | 1       | 2          |
| 2020-12-7 | honda     | 2       | 1          |
+-----------+-----------+---------+------------+
输出:
+-----------+-----------+--------------+-----------------+
| date_id   | make_name | unique_leads | unique_partners |
+-----------+-----------+--------------+-----------------+
| 2020-12-8 | toyota    | 2            | 3               |
| 2020-12-7 | toyota    | 1            | 2               |
| 2020-12-8 | honda     | 2            | 2               |
| 2020-12-7 | honda     | 3            | 2               |
+-----------+-----------+--------------+-----------------+
解释:
在 2020-12-8,丰田(toyota)有领导者 = [0, 1] 和合伙人 = [0, 1, 2] ,同时本田(honda)有领导者 = [1, 2] 和合伙人 = [1, 2]。
在 2020-12-7,丰田(toyota)有领导者 = [0] 和合伙人 = [1, 2] ,同时本田(honda)有领导者 = [0, 1, 2] 和合伙人 = [1, 2]。
测试数据:
1
2
3
4
data = {'date_id': ['2020-12-8', '2020-12-8', '2020-12-8', '2020-12-7', '2020-12-7', '2020-12-8', '2020-12-8', '2020-12-7', '2020-12-7', '2020-12-7'],
        'make_name': ['toyota', 'toyota', 'toyota', 'toyota', 'toyota', 'honda', 'honda', 'honda', 'honda', 'honda'],
        'lead_id': [0, 1, 1, 0, 0, 1, 2, 0, 1, 2],
        'partner_id': [1, 0, 2, 2, 1, 2, 1, 1, 2, 1]}
通过这道题可以领略agg函数的强大:
1
2
3
4
5
6
7
import pandas as pd

def daily_leads_and_partners(daily_sales: pd.DataFrame) -> pd.DataFrame:
    return daily_sales.groupby(['date_id', 'make_name']).agg(
        unique_leads=('lead_id', 'nunique'),
        unique_partners=('partner_id', 'nunique')
    ).reset_index()
数据合并
1050. 合作过至少三次的演员和导演
ActorDirector 表:
1
2
3
4
5
6
7
8
+-------------+---------+
| Column Name | Type    |
+-------------+---------+
| actor_id    | int     |
| director_id | int     |
| timestamp   | int     |
+-------------+---------+
timestamp 是这张表的主键(具有唯一值的列).
编写解决方案找出合作过至少三次的演员和导演的 id 对 (actor_id, director_id)
示例 1:
1
2
3
4
5
6
7
8
9
10
11
12
13
14
15
16
17
18
19
20
21
输入:
ActorDirector 表:
+-------------+-------------+-------------+
| actor_id    | director_id | timestamp   |
+-------------+-------------+-------------+
| 1           | 1           | 0           |
| 1           | 1           | 1           |
| 1           | 1           | 2           |
| 1           | 2           | 3           |
| 1           | 2           | 4           |
| 2           | 1           | 5           |
| 2           | 1           | 6           |
+-------------+-------------+-------------+
输出:
+-------------+-------------+
| actor_id    | director_id |
+-------------+-------------+
| 1           | 1           |
+-------------+-------------+
解释:
唯一的 id 对是 (1, 1),他们恰好合作了 3 次。
测试数据:
1
2
3
data = {'actor_id': [1, 1, 1, 1, 1, 2, 2],
        'director_id': [1, 1, 1, 2, 2, 1, 1],
        'timestamp': [0, 1, 2, 3, 4, 5, 6]}
这题比较简单,我写的答案:
1
2
3
4
5
import pandas as pd

def actors_and_directors(actor_director: pd.DataFrame) -> pd.DataFrame:
    grouped = actor_director.groupby(['actor_id', 'director_id'])['timestamp'].count().reset_index()
    return grouped[grouped['timestamp'] >=3][['actor_id', 'director_id']]
1378. 使用唯一标识码替换员工ID
Employees 表:
1
2
3
4
5
6
7
8
+---------------+---------+
| Column Name   | Type    |
+---------------+---------+
| id            | int     |
| name          | varchar |
+---------------+---------+
在 SQL 中,id 是这张表的主键。
这张表的每一行分别代表了某公司其中一位员工的名字和 ID 。
EmployeeUNI 表:
1
2
3
4
5
6
7
8
+---------------+---------+
| Column Name   | Type    |
+---------------+---------+
| id            | int     |
| unique_id     | int     |
+---------------+---------+
在 SQL 中,(id, unique_id) 是这张表的主键。
这张表的每一行包含了该公司某位员工的 ID 和他的唯一标识码(unique ID)。
展示每位用户的 唯一标识码(unique ID );如果某位员工没有唯一标识码,使用 null 填充即可。
你可以以 任意 顺序返回结果表。
返回结果的格式如下例所示。
示例 1:
1
2
3
4
5
6
7
8
9
10
11
12
13
14
15
16
17
18
19
20
21
22
23
24
25
26
27
28
29
30
31
32
33
34
输入:
Employees 表:
+----+----------+
| id | name     |
+----+----------+
| 1  | Alice    |
| 7  | Bob      |
| 11 | Meir     |
| 90 | Winston  |
| 3  | Jonathan |
+----+----------+
EmployeeUNI 表:
+----+-----------+
| id | unique_id |
+----+-----------+
| 3  | 1         |
| 11 | 2         |
| 90 | 3         |
+----+-----------+
输出:
+-----------+----------+
| unique_id | name     |
+-----------+----------+
| null      | Alice    |
| null      | Bob      |
| 2         | Meir     |
| 3         | Winston  |
| 1         | Jonathan |
+-----------+----------+
解释:
Alice and Bob 没有唯一标识码, 因此我们使用 null 替代。
Meir 的唯一标识码是 2 。
Winston 的唯一标识码是 3 。
Jonathan 唯一标识码是 1 。
测试数据:
1
2
3
4
5
{'id': [1, 7, 11, 90, 3],
                  'name': ['Alice', 'Bob', 'Meir', 'Winston', 'Jonathan']}

{'id': [3, 11, 90],
                     'unique_id': [1, 2, 3]}
这题非常简单啊,一个merge搞定(注意how值是left)
1
2
3
4
5
import pandas as pd

def replace_employee_id(employees: pd.DataFrame, employee_uni: pd.DataFrame) -> pd.DataFrame:
    return pd.merge(employees, employee_uni, how='left')[['unique_id', 'name']]
1280. 学生们参加各科测试的次数
学生表: Students
1
2
3
4
5
6
7
8
+---------------+---------+
| Column Name   | Type    |
+---------------+---------+
| student_id    | int     |
| student_name  | varchar |
+---------------+---------+
在 SQL 中,主键为 student_id(学生ID)。
该表内的每一行都记录有学校一名学生的信息。
科目表: Subjects
1
2
3
4
5
6
7
+--------------+---------+
| Column Name  | Type    |
+--------------+---------+
| subject_name | varchar |
+--------------+---------+
在 SQL 中,主键为 subject_name(科目名称)。
每一行记录学校的一门科目名称。
考试表: Examinations
1
2
3
4
5
6
7
8
9
+--------------+---------+
| Column Name  | Type    |
+--------------+---------+
| student_id   | int     |
| subject_name | varchar |
+--------------+---------+
这个表可能包含重复数据(换句话说,在 SQL 中,这个表没有主键)。
学生表里的一个学生修读科目表里的每一门科目。
这张考试表的每一行记录就表示学生表里的某个学生参加了一次科目表里某门科目的测试。
查询出每个学生参加每一门科目测试的次数,结果按 student_id 和 subject_name 排序。
查询结构格式如下所示。
示例 1:
1
2
3
4
5
6
7
8
9
10
11
12
13
14
15
16
17
18
19
20
21
22
23
24
25
26
27
28
29
30
31
32
33
34
35
36
37
38
39
40
41
42
43
44
45
46
47
48
49
50
51
52
53
54
55
56
57
输入:
Students table:
+------------+--------------+
| student_id | student_name |
+------------+--------------+
| 1          | Alice        |
| 2          | Bob          |
| 13         | John         |
| 6          | Alex         |
+------------+--------------+
Subjects table:
+--------------+
| subject_name |
+--------------+
| Math         |
| Physics      |
| Programming  |
+--------------+
Examinations table:
+------------+--------------+
| student_id | subject_name |
+------------+--------------+
| 1          | Math         |
| 1          | Physics      |
| 1          | Programming  |
| 2          | Programming  |
| 1          | Physics      |
| 1          | Math         |
| 13         | Math         |
| 13         | Programming  |
| 13         | Physics      |
| 2          | Math         |
| 1          | Math         |
+------------+--------------+
输出:
+------------+--------------+--------------+----------------+
| student_id | student_name | subject_name | attended_exams |
+------------+--------------+--------------+----------------+
| 1          | Alice        | Math         | 3              |
| 1          | Alice        | Physics      | 2              |
| 1          | Alice        | Programming  | 1              |
| 2          | Bob          | Math         | 1              |
| 2          | Bob          | Physics      | 0              |
| 2          | Bob          | Programming  | 1              |
| 6          | Alex         | Math         | 0              |
| 6          | Alex         | Physics      | 0              |
| 6          | Alex         | Programming  | 0              |
| 13         | John         | Math         | 1              |
| 13         | John         | Physics      | 1              |
| 13         | John         | Programming  | 1              |
+------------+--------------+--------------+----------------+
解释:
结果表需包含所有学生和所有科目(即便测试次数为0):
Alice 参加了 3 次数学测试, 2 次物理测试,以及 1 次编程测试;
Bob 参加了 1 次数学测试, 1 次编程测试,没有参加物理测试;
Alex 啥测试都没参加;
John  参加了数学、物理、编程测试各 1 次。
测试数据:
1
2
3
4
5
6
7
8
9
10
11
12
13
14
students_data = {'student_id': [1, 2, 13, 6],
                 'student_name': ['Alice', 'Bob', 'John', 'Alex']}
subjects_data = {'subject_name': ['Math', 'Physics', 'Programming']}
examinations_data = {'student_id': [1, 1, 1, 2, 1, 1, 13, 13, 13, 2, 1],
                     'subject_name': ['Math', 'Physics', 'Programming', 'Programming', 'Physics', 'Math', 'Math', 'Programming', 'Physics', 'Math', 'Math']}


students = pd.DataFrame(students_data)
subjects = pd.DataFrame(subjects_data)
examinations = pd.DataFrame(examinations_data)
display(students)
display(subjects)
display(examinations)
要完成这道题要首先掌握笛卡尔积:计算所有可能的元素对的乘积
1
2
3
4
students['key'] = 1
subjects['key'] = 1

pd.merge(students, subjects, on='key')
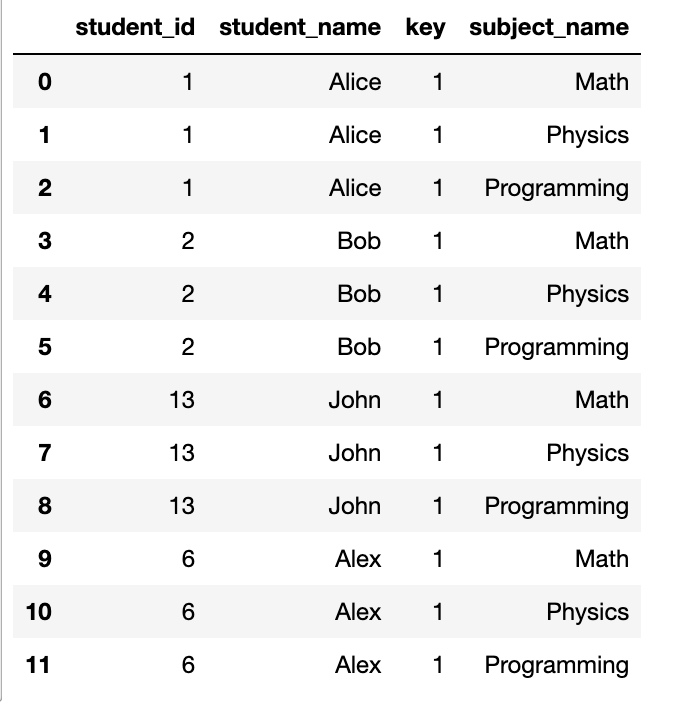
这样就有了输出的雏形。
这道题,还有很多小细节要注意。可以边写边测试,有了结果提交发现不通过 也可以再调试。
1
2
3
4
5
6
7
8
9
10
11
import pandas as pd

def students_and_examinations(students: pd.DataFrame, subjects: pd.DataFrame, examinations: pd.DataFrame) -> pd.DataFrame:
    students['key'] = 1
    subjects['key'] = 1
    res = pd.merge(students, subjects, on='key')
    count_examinations = examinations.groupby(['student_id', 'subject_name']).size().reset_index(name='attended_exams')
    res = pd.merge(res, count_examinations, on=['student_id', 'subject_name'], how='left')
    res['attended_exams'] = res['attended_exams'].fillna(0)
    res = res[['student_id', 'student_name', 'subject_name', 'attended_exams']]
    return res.sort_values(by=['student_id', 'subject_name'])
注:
1.size()和count()
2.某一列的值(含NaN)赋值:res['attended_exams'] = res['attended_exams'].fillna(0), 因为名字这一列可能出现null,不可被覆盖,所以只对一列进行nan的填充。
3.reset_index(name='attended_exams'),groupby后统计的结果赋值给某一列,给那一列取个新名字
4.笛卡尔积:
1
2
3
    students['key'] = 1
    subjects['key'] = 1
    res = pd.merge(students, subjects, on='key')
570. 至少有5名直接下属的经理
表: Employee
1
2
3
4
5
6
7
8
9
10
11
12
+-------------+---------+
| Column Name | Type    |
+-------------+---------+
| id          | int     |
| name        | varchar |
| department  | varchar |
| managerId   | int     |
+-------------+---------+
id 是此表的主键(具有唯一值的列)。
该表的每一行表示雇员的名字、他们的部门和他们的经理的id。
如果managerId为空,则该员工没有经理。
没有员工会成为自己的管理者。
编写一个解决方案,找出至少有五个直接下属的经理。
以 任意顺序 返回结果表。
查询结果格式如下所示。
示例 1:
1
2
3
4
5
6
7
8
9
10
11
12
13
14
15
16
17
18
输入:
Employee 表:
+-----+-------+------------+-----------+
| id  | name  | department | managerId |
+-----+-------+------------+-----------+
| 101 | John  | A          | Null      |
| 102 | Dan   | A          | 101       |
| 103 | James | A          | 101       |
| 104 | Amy   | A          | 101       |
| 105 | Anne  | A          | 101       |
| 106 | Ron   | B          | 101       |
+-----+-------+------------+-----------+
输出:
+------+
| name |
+------+
| John |
+------+
测试数据:
1
2
3
4
5
6
7
8
9
employee_data = {
    'id': [101, 102, 103, 104, 105, 106],
    'name': ['John', 'Dan', 'James', 'Amy', 'Anne', 'Ron'],
    'department': ['A', 'A', 'A', 'A', 'A', 'B'],
    'managerId': [None, 101, 101, 101, 101, 101]  # 使用 np.nan 表示 Null
}

employee = pd.DataFrame(employee_data)
display(employee)
我写的:
1
2
3
4
5
6
import pandas as pd

def find_managers(employee: pd.DataFrame) -> pd.DataFrame:
    count_managerId = employee.groupby('managerId').size().reset_index(name='count_e').rename(columns={'managerId':'id'})
    res = pd.merge(employee, count_managerId, on='id', how='left')
    return res[res['count_e'] >= 5][['name']]
607. 销售员
表: SalesPerson
1
2
3
4
5
6
7
8
9
10
11
+-----------------+---------+
| Column Name     | Type    |
+-----------------+---------+
| sales_id        | int     |
| name            | varchar |
| salary          | int     |
| commission_rate | int     |
| hire_date       | date    |
+-----------------+---------+
sales_id 是该表的主键列(具有唯一值的列)。
该表的每一行都显示了销售人员的姓名和 ID ,以及他们的工资、佣金率和雇佣日期。
表: Company
1
2
3
4
5
6
7
8
9
+-------------+---------+
| Column Name | Type    |
+-------------+---------+
| com_id      | int     |
| name        | varchar |
| city        | varchar |
+-------------+---------+
com_id 是该表的主键列(具有唯一值的列)。
该表的每一行都表示公司的名称和 ID ,以及公司所在的城市。
表: Orders
1
2
3
4
5
6
7
8
9
10
11
12
13
+-------------+------+
| Column Name | Type |
+-------------+------+
| order_id    | int  |
| order_date  | date |
| com_id      | int  |
| sales_id    | int  |
| amount      | int  |
+-------------+------+
order_id 是该表的主键列(具有唯一值的列)。
com_id 是 Company 表中 com_id 的外键(reference 列)。
sales_id 是来自销售员表 sales_id 的外键(reference 列)。
该表的每一行包含一个订单的信息。这包括公司的 ID 、销售人员的 ID 、订单日期和支付的金额。
编写解决方案,找出没有任何与名为 “RED” 的公司相关的订单的所有销售人员的姓名。
以 任意顺序 返回结果表。
返回结果格式如下所示。
示例 1:
1
2
3
4
5
6
7
8
9
10
11
12
13
14
15
16
17
18
19
20
21
22
23
24
25
26
27
28
29
30
31
32
33
34
35
36
37
38
39
40
输入:
SalesPerson 表:
+----------+------+--------+-----------------+------------+
| sales_id | name | salary | commission_rate | hire_date  |
+----------+------+--------+-----------------+------------+
| 1        | John | 100000 | 6               | 4/1/2006   |
| 2        | Amy  | 12000  | 5               | 5/1/2010   |
| 3        | Mark | 65000  | 12              | 12/25/2008 |
| 4        | Pam  | 25000  | 25              | 1/1/2005   |
| 5        | Alex | 5000   | 10              | 2/3/2007   |
+----------+------+--------+-----------------+------------+
Company 表:
+--------+--------+----------+
| com_id | name   | city     |
+--------+--------+----------+
| 1      | RED    | Boston   |
| 2      | ORANGE | New York |
| 3      | YELLOW | Boston   |
| 4      | GREEN  | Austin   |
+--------+--------+----------+
Orders 表:
+----------+------------+--------+----------+--------+
| order_id | order_date | com_id | sales_id | amount |
+----------+------------+--------+----------+--------+
| 1        | 1/1/2014   | 3      | 4        | 10000  |
| 2        | 2/1/2014   | 4      | 5        | 5000   |
| 3        | 3/1/2014   | 1      | 1        | 50000  |
| 4        | 4/1/2014   | 1      | 4        | 25000  |
+----------+------------+--------+----------+--------+
输出:
+------+
| name |
+------+
| Amy  |
| Mark |
| Alex |
+------+
解释:
根据表 orders 中的订单 '3' 和 '4' ,容易看出只有 'John' 和 'Pam' 两个销售员曾经向公司 'RED' 销售过。
所以我们需要输出表 salesperson 中所有其他人的名字。
测试数据:
1
2
3
4
5
6
7
8
9
10
11
12
13
14
15
16
17
18
19
20
21
22
23
24
25
26
27
28
29
salesperson_data = {
    'sales_id': [1, 2, 3, 4, 5],
    'name': ['John', 'Amy', 'Mark', 'Pam', 'Alex'],
    'salary': [100000, 12000, 65000, 25000, 5000],
    'commission_rate': [6, 5, 12, 25, 10],
    'hire_date': ['4/1/2006', '5/1/2010', '12/25/2008', '1/1/2005', '2/3/2007']
}

company_data = {
    'com_id': [1, 2, 3, 4],
    'name': ['RED', 'ORANGE', 'YELLOW', 'GREEN'],
    'city': ['Boston', 'New York', 'Boston', 'Austin']
}

orders_data = {
    'order_id': [1, 2, 3, 4],
    'order_date': ['1/1/2014', '2/1/2014', '3/1/2014', '4/1/2014'],
    'com_id': [3, 4, 1, 1],
    'sales_id': [4, 5, 1, 4],
    'amount': [10000, 5000, 50000, 25000]
}


sales_person = pd.DataFrame(salesperson_data)
company = pd.DataFrame(company_data)
orders = pd.DataFrame(orders_data)
display(sales_person)
display(company)
display(orders)
本来都写完了,跑“提交”的时候出现了没有RED公司的情况,所以多加一层判断(直接返回所有的销售人员姓名):
1
2
3
4
5
6
7
8
import pandas as pd

def sales_person(sales_person: pd.DataFrame, company: pd.DataFrame, orders: pd.DataFrame) -> pd.DataFrame:
    if (company['name'] == 'RED').any():
        red_com_id = company['com_id'][company['name'] == 'RED'].values[0]
        return sales_person[~sales_person['sales_id'].isin(orders["sales_id"][orders['com_id'] == red_com_id])][['name']]
    else:
        return sales_person[['name']]
测验题
2041. 面试中被录取的候选人
表:Candidates
1
2
3
4
5
6
7
8
9
10
+--------------+----------+
| Column Name  | Type     |
+--------------+----------+
| candidate_id | int      |
| name         | varchar  |
| years_of_exp | int      |
| interview_id | int      |
+--------------+----------+
candidate_id 是这个表的主键(具有唯一值的列)。
该表的每一行都表示候选人的姓名、工作年限以及面试 ID 。
表:Rounds
1
2
3
4
5
6
7
8
9
+--------------+------+
| Column Name  | Type |
+--------------+------+
| interview_id | int  |
| round_id     | int  |
| score        | int  |
+--------------+------+
(interview_id, round_id)是本表的主键(具有唯一值的列的组合)。
本表的每一行都表示一轮面试的分数
编写解决方案,找出 至少有两年 工作经验、且面试分数之和 严格大于 15 的候选人的 ID 。
可以以 任何顺序 返回结果表。
查询结果的格式如下例所示。
示例 1:
1
2
3
4
5
6
7
8
9
10
11
12
13
14
15
16
17
18
19
20
21
22
23
24
25
26
27
28
29
30
31
32
33
34
35
36
37
38
输入:
Candidates table:
+--------------+---------+--------------+--------------+
| candidate_id | name    | years_of_exp | interview_id |
+--------------+---------+--------------+--------------+
| 11           | Atticus | 1            | 101          |
| 9            | Ruben   | 6            | 104          |
| 6            | Aliza   | 10           | 109          |
| 8            | Alfredo | 0            | 107          |
+--------------+---------+--------------+--------------+
Rounds table:
+--------------+----------+-------+
| interview_id | round_id | score |
+--------------+----------+-------+
| 109          | 3        | 4     |
| 101          | 2        | 8     |
| 109          | 4        | 1     |
| 107          | 1        | 3     |
| 104          | 3        | 6     |
| 109          | 1        | 4     |
| 104          | 4        | 7     |
| 104          | 1        | 2     |
| 109          | 2        | 1     |
| 104          | 2        | 7     |
| 107          | 2        | 3     |
| 101          | 1        | 8     |
+--------------+----------+-------+
输出:
+--------------+
| candidate_id |
+--------------+
| 9            |
+--------------+
解释:
- 候选人 11 :总分是 16 ,1 年工作经验。由于工作年限,不列入结果表。
- 候选人 9 :总分是 22 ,6 年工作经验。列入结果表。
- 候选人 6 :总分是 10 ,10 年工作经验。由于分数不足,不列入结果表。
- 候选人 8 :总分是 6 ,0 年工作经验。由于工作年限和分数,不列入结果表。
测试数据:
1
我写的答案:
1
2
3
4
5
6
7
import pandas as pd

def accepted_candidates(candidates: pd.DataFrame, rounds: pd.DataFrame) -> pd.DataFrame:
    merged = pd.merge(candidates, rounds, how='right')
    sum_ = merged.groupby('candidate_id')['score'].sum().reset_index()
    return candidates[(candidates['candidate_id'].isin(sum_['candidate_id'][sum_['score'] > 15])) & (candidates['years_of_exp'] >= 2)][['candidate_id']]
以上就完成了整个刷题计划。
